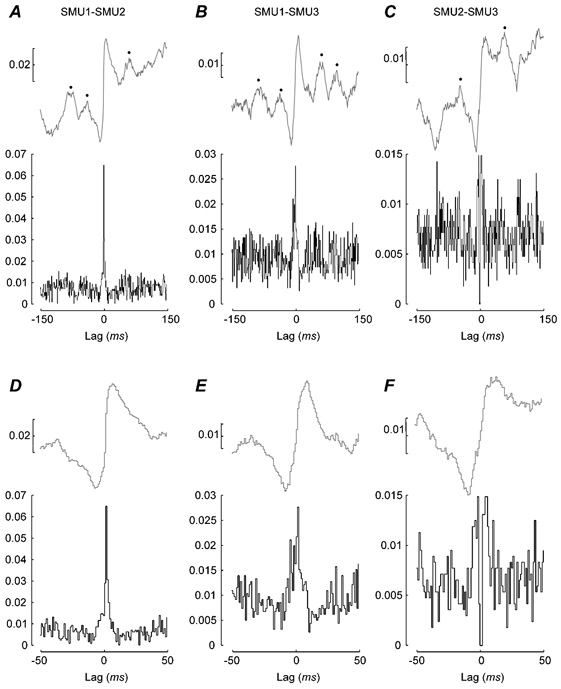
Figure 4. Motor unit synchronisation: single subject data.

A-F, the synchrony measured in the time domain between three different units recorded from the right 1DI muscle during the HI-COMP task (subject JL). The data shown were pooled across both hold periods. A-C, the cross-correlations with a lag of 150 ms. D-F, the same data but only plotting the central 100 ms. A and D, the correlation between SMU1 and SMU2; B and E, the correlation between SMU1 and SMU3; and C and F, the correlation between SMU2 and SMU3. The black lines show the cross-correlograms calculated with a 1 ms resolution and the grey lines show the cusum. The ordinate on the cross-correlograms is the ratio of synchronous events to the total number of reference events. The scale of the cusum is the value ‘b’ (see Methods). Number of trials 25; number of events: n = 2038 for SMU1; 1314 for SMU2 and 1627 for SMU3.
