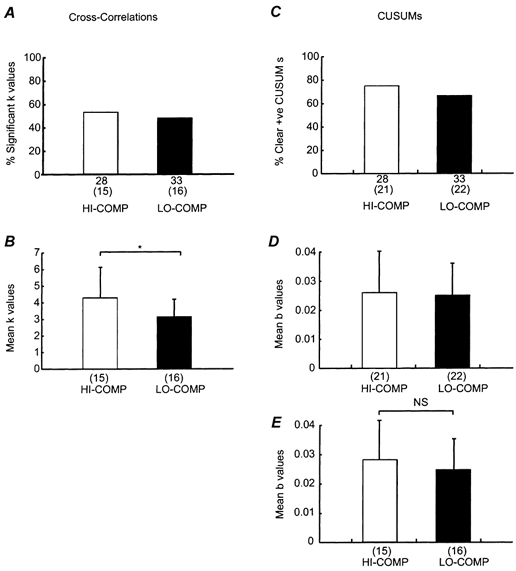
Figure 5. Motor unit synchronisation: pooled subject data.

A and B, the cross-correlation data and (C-E) the cusum data for motor unit pairs from all five subjects analysed. A, the percentage of significant ‘k’ values for the HI-COMP (open bars) and LO-COMP (black bars). The total number of motor unit pairs is shown under each column, with the number significant shown in brackets. C, the corresponding data for the percentage of clear positive peaks in the cusum. B, the mean ‘k’ value for the two different task conditions. D shows the mean cusum ‘b’ value from all correlations with a clear positive deflection whereas in E the mean cusum ‘b’ value from correlations with significant ‘k’ values only are shown. The n number is shown under each column. Standard error bars are shown where possible. *= significant difference, P < 0.05 Mann-Whitney, NS = non-significant difference.
