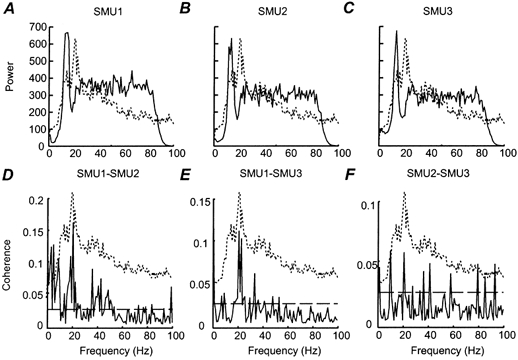
Figure 6. Single subject data: power and coherence spectra during the HI-COMP task.

A-C, the power spectra calculated using a 1024 pt FFT window for three SMUs recorded from right 1DI and pooled over the two hold periods (subject JL). These SMUs are the same as those shown in Fig. 3. D-F, the coherence spectra calculated between pairs of the power spectra shown in A-C. The dashed horizontal line indicates the 95 % confidence limit. Peaks in the coherence spectra were only considered significant if three consecutive bins were above this confidence limit. Superimposed on each plot is the power spectrum of the 1DI surface EMG recording (dashed line) calculated over the two HOLD periods. The scale of these power spectra does not correspond to the scale given on the y axis, which only applies to the SMU data.
