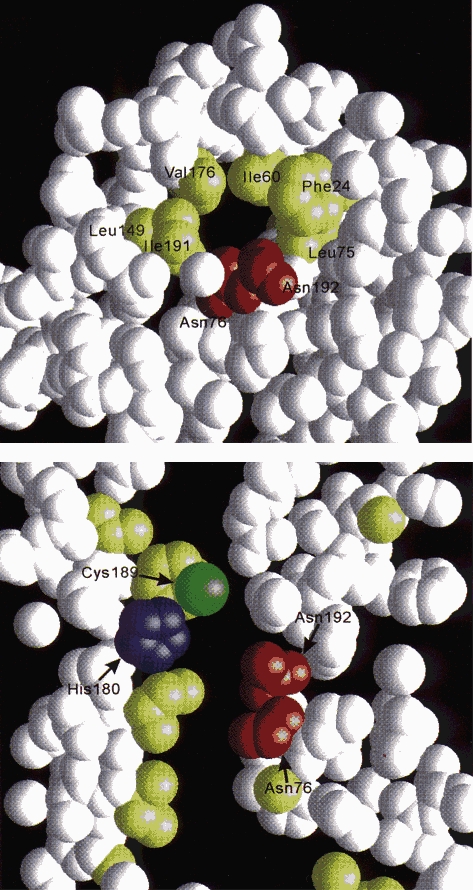
Figure 3. AQP1 structure determined by electron crystallography.

Space-filling model of AQP1 reveals three dimensional structure of aqueous pore. Top, horizontal section midway through AQP1 subunit shows 3 Å pore surrounded by hydrophobic residues (yellow) and tandem hydrogen-binding sites (Asn-192 and Asn-76, red). Bottom, vertical section shows aqueous channel lined by functionally important residues (Cys-189, His-180, Asn-76 and Asn-192; Arg-195 is not shown). Reprinted from Nature with permission (Murata et al. 2000).
