
Figure 1. Dim background light increases ‘on’ bipolar cell flash sensitivity.
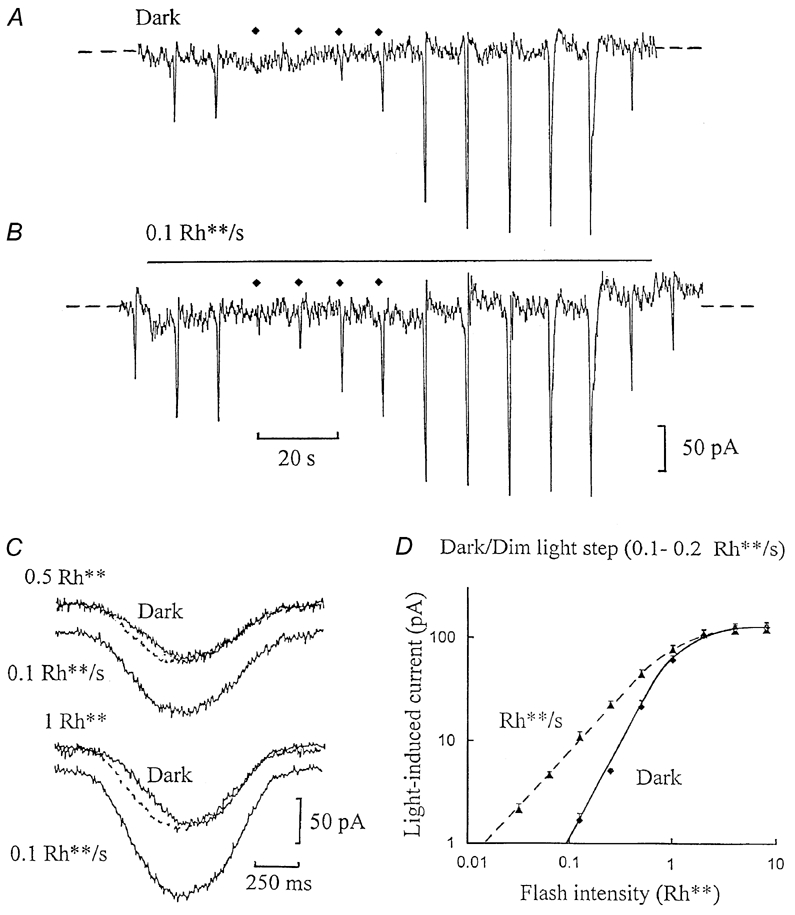
A, whole-cell voltage-clamp recording from an ‘on’ bipolar cell in a dogfish retinal slice in the dark. The cell was clamped to its dark potential of -36 mV; the zero-current level is indicated by the dashed lines, the recording beginning just after establishing the whole-cell configuration. Two inward current flash responses were elicited by 0.5 Rh** test flashes, and then the flash intensity was reduced to 0.0625 rhodopsin molecules isomerised per rod (Rh**), which was too dim to elicit a response. The flash intensity was then raised sequentially by factors of 2, applied at 10 s intervals (the timing of the dim flashes, up to 0.5 Rh**, is indicated by the diamonds above the traces), up to 16 Rh**, which elicited a saturating flash response. B is a continuation(without break) of trace A. A dim background light step isomerising 0.1 Rh** s−1 was applied, of duration indicated by the bar above the trace. The same series of flashes, as in trace A, was then superimposed on the dim background. C, change in the time course induced by the same background, from another ‘on’ bipolar whole-cell recording. Responses to dim (0.5 Rh**) and half-saturating (1 Rh**) flashes are shown, recorded in the dark and with 0.1 Rh** s−1 background light. The responses are displaced from zero current in the dark by the sustained inward current induced by the background, in each case synchronised to the timing of the flash at the beginning of the records. Responses potentiated by the background were scaled down in amplitude to match the responses in the dark, and were superimposed (stippled traces). D, the flash intensity-current response (I-R) relationships derived from 10 ‘on’ bipolar cell recordings in the dark (♦, continuous curve), just after establishing the whole-cell configuration, and against dim backgrounds (0.1-0.2 Rh** s−1; ▴, dashed curve), shown on logarithmic axes. Current responses to flashes were measured in the dark from the dark current level to the peak of the flash responses, whilst those with background light were measured from the steady inward current level induced by the background (mean shift, -12 ± 2 pA). The slope of the curve in the dark was 1.8, which reduced to 1.2 with background light. Positive standard error bars are shown about the mean values.