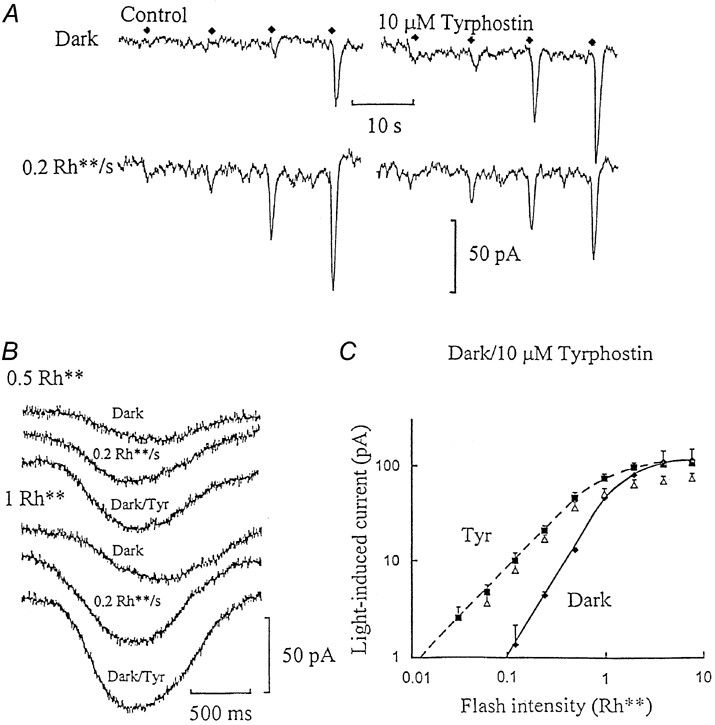
Figure 3. Inhibition of tyrosine kinase activity reproduces the effect of background light or cGMP.

A, ‘on’ bipolar whole-cell voltage-clamp recording obtained just after establishing the whole-cell configuration (Control) and on equilibration with 10 μM tyrphostin A48 added to the patch-pipette solution. Only the responses to the lower range of flash intensities are shown (up to 0.5 Rh**, flash timing indicated by the diamonds) in the dark (upper traces) and with dim (0.2 Rh** s−1) backgrounds (lower traces). B, changes in the time course induced by the same background, and with tyrphostin (Tyr) in the dark, from the same ‘on’ bipolar whole-cell recording shown in A. Responses to dim (0.5 Rh**) and half-saturating (1 Rh**) flashes are shown, recorded in the dark, with 0.2 Rh** s−1 backgrounds, and on equilibration with tyrphostin in the dark (dark/Tyr). The responses are displaced from each other to aid waveform comparison, in each case synchronised to the timing of the flash at the beginning of the records. This recording was obtained at 15 °C to slow down the flash response kinetics. C, the I-R relationships derived from three ‘on’ bipolar cell recordings with 10 μM tyrphostin. Flash responses measured in the dark control were obtained just after establishing the whole-cell configuration (♦, continuous curve), on equilibration with tyrphostin in the dark (▪, dashed curve) and on equilibration against 0.2 Rh** s−1 backgrounds (▵). The slope of the dark control curve was 1.8, which decreased to 1.2 with tyrphostin in the dark or with background light.
