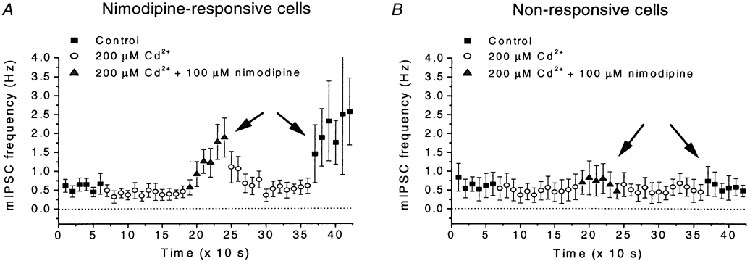
Figure 4. Effects of Cd2+ and of nimodipine in the presence of Cd2+ on mIPSC frequency.

The cells were grouped on basis of a significant response to nimodipine (100 μM) when added to control solution. A, nimodipine-responsive cells (n = 6). B, non-responsive cells (n = 5). Note that nimodipine-sensitive cells also showed some response in Cd2+ (200 μM), and that the sensitivity to nimodipine was correlated with an increased mIPSC frequency after washout of Cd2+, which was not seen in the non-responsive cells. Correlation marked by arrows in A and B. Recording conditions and data presentation similar to those in Fig. 2A.
