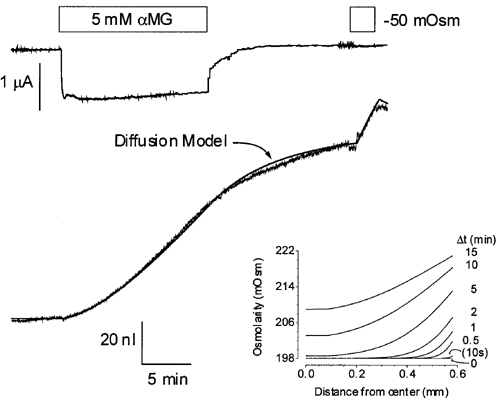
Figure 2. Cotransport-stimulated cell swelling.

The continuous smooth line represents the fit provided by the diffusion model using the parameters described in the text. The inset shows the osmolarity profiles from the centre of the oocyte to the plasma membrane as a function of time after initiating the cotransport current.
