
Figure 5.
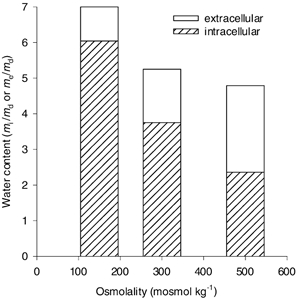
Distribution of water in normal and osmotically challenged slices
Cumulative bar graph shows intracellular, extracellular and total water (sum of the two) in normal (305 mosmol kg−1), hypotonic (150 mosmol kg−1) and hypertonic (500 mosmol kg−1) ACSF, based on data in Table 2. The figure shows that in hypertonic medium the water content of the ECS exceeds that of the intracellular compartment. Note that the total water content of the slice increases in hypotonic medium and decreases slightly in hypertonic medium.