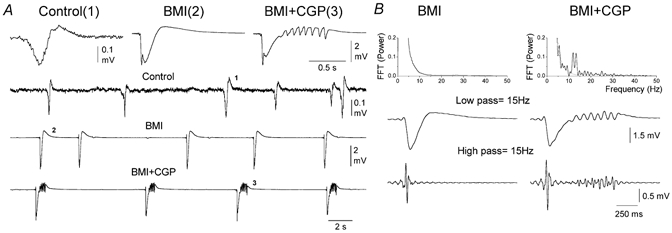
Figure 1.

Spontaneous activity in agranular neocortex slices during control conditions and during disinhibition
A, examples of field potential recordings from layer III of agranular neocortex during control conditions (Control), during subsequent application of the GABAA receptor antagonist bicuculline (BMI, 10 μm) and during application of BMI plus the GABAB receptor antagonist CGP35348 (BMI+CGP, 10+500 μm). The upper traces show single numbered events, on an expanded time scale, taken from corresponding points on the continuous recording shown below. B, power spectrum analysis of spontaneous activities induced by disinhibition in agranular neocortex. Upper panel, fast Fourier transforms (FFT) of a representative discharge induced by BMI (left) and by BMI plus CGP35348 (right). In the right panel the two FFTs are overlaid for comparison. Lower panels, digital filtering of the representative discharges. Low-pass filtering at 15 Hz and high-pass filtering at 15 Hz.
