
Figure 2.
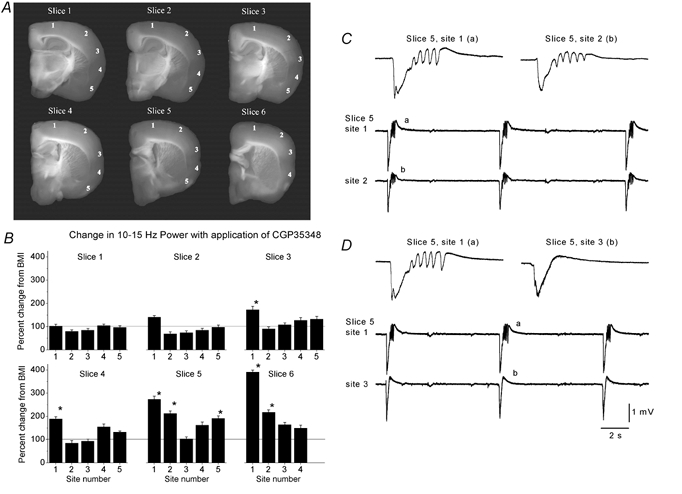
Region specificity of 10 Hz synchronized oscillations
A, six representative slices cut in the thalamocortical plane and taken sequentially from caudal (slice 1) to most rostral (slice 6). The numbers on each slice (1-5) mark the location where the recordings were performed. B, recordings were performed in slices bathed with BMI before and during the application of CGP35348. The plots show the percentage change in the 10–15 Hz power range after application of CGP35348 for every recording site and slice shown above. The data are means ± s.d. from n = 6 experiments (36 slices). Asterisks indicate a significant change with respect to BMI alone. Note the enhancement in 10–15 Hz power in sites 1 and 2 of slices 5 and 6. C, simultaneous field potential recordings from sites 1 and 2 of slice 5 as shown in A during application of BMI+CGP35348. Note the occurrence of 10 Hz oscillations in both sites. D, subsequent positioning of the recording electrode from site 2 to 3 reveals that site 3 does not express 10 Hz oscillations but only a discharge consisting of a large amplitude negative spike followed by a positive wave, while site 1 continues to produce 10 Hz oscillations. The letters on the single events shown on the upper traces correspond to the events shown below on the continuous recordings.