
Figure 9.
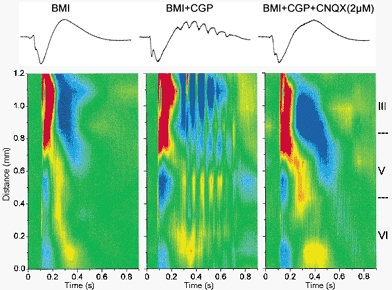
Effect of 2 μm CNQX on 10 Hz oscillations measured with CSD analysis in the agranular neocortex
Upper panel, traces corresponding to the CSD analyses shown below recorded from one of the sites on the 16-channel probe. Lower panel, CSD analysis corresponding to spontaneous discharges generated in the agranular cortex during application of BMI, BMI+CGP35348 and BMI+CGP35348+CNQX (2 μm). Note the abolishment of all current flow associated with the oscillation after application of CNQX.