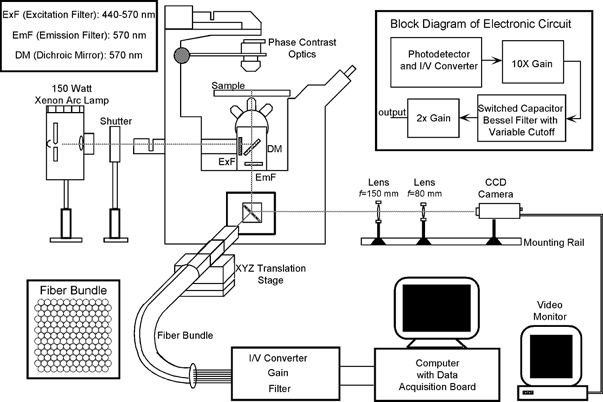
Figure 1.

Schematic representation of the experimental setup
An optical fibre bundle-based system was used to record fluorescence signals (see text for details). The grey line traces the optical pathway. The insets on the top left and right give the details of the optical filters and the electronic circuits, respectively. The face of the fibre bundle consisting of 149 optical fibres is shown in the inset at the bottom left.
