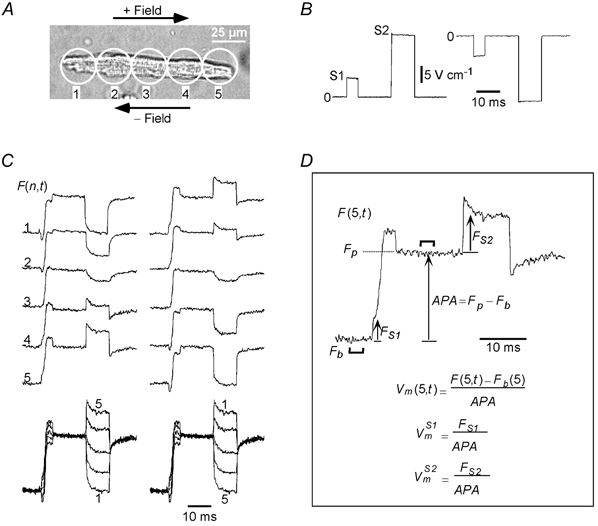
Figure 2.

Typical S1-S2-induced Vm s
A, image of an adult guinea-pig cell that was stimulated with both positive and negative pairs of S1-S2 pulses. The field pulses were measured to be +5.5/+21.6 V cm−1 and −5.6/-20.9 V cm−1, and are shown in B. C, left and right columns show the Vm responses to the positive and negative fields, respectively, and demonstrate reversal in and at all sites with reversal of field polarity. The last row in C shows the Vm responses superimposed from all sites. The transitions between the uniformly polarized and non-uniformly polarized states of the cell at the onset and cessation of the S1 and S2 pulses are clearly visible. D, illustration of the method to define the S1- and S2-induced Vm responses from the fluorescence signals, using the signal recorded from site 5 (F(5,t)) for the positive field as an example. The action potential amplitude (APA) was computed as the difference between baseline fluorescence (Fb) and plateau fluorescence (Fp), each being averaged over a 3 ms duration (indicated by thick lines) during rest and plateau, respectively. The formulae for computing the S1- and S2-induced responses ( and ) are also shown in D. Cell length: 128 μm.
