
Figure 6.
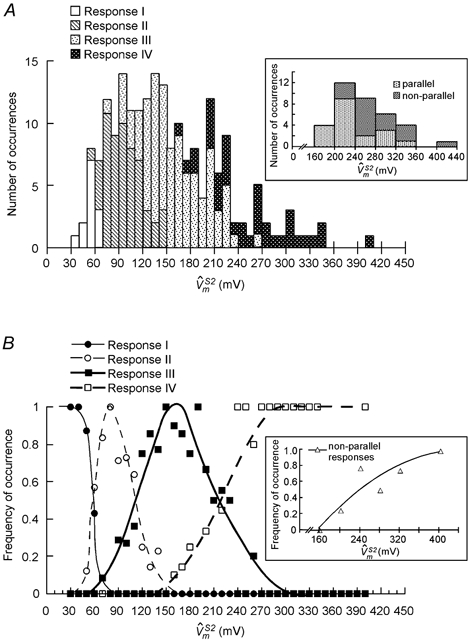
Summary of response types for all cells (n = 57)
A, histogram summarizing the number of occurrences of various response types of over the entire range of values. The inset shows sub-distribution of type IV responses into parallel and non-parallel time courses. The symbols in B represent frequency of occurrence of various response types for each bin. The curves drawn by eye through these symbols can be used to estimate the thresholds for occurrence of various response types. Inset in B is a frequency plot corresponding to inset of A, and depicts occurrence of non-parallel responses as a function of . The curve is a second degree polynomial fit through the data. Note that a larger bin size was chosen for the insets to enhance the confidence in tracking the trend of non-parallel type IV responses with increasing .