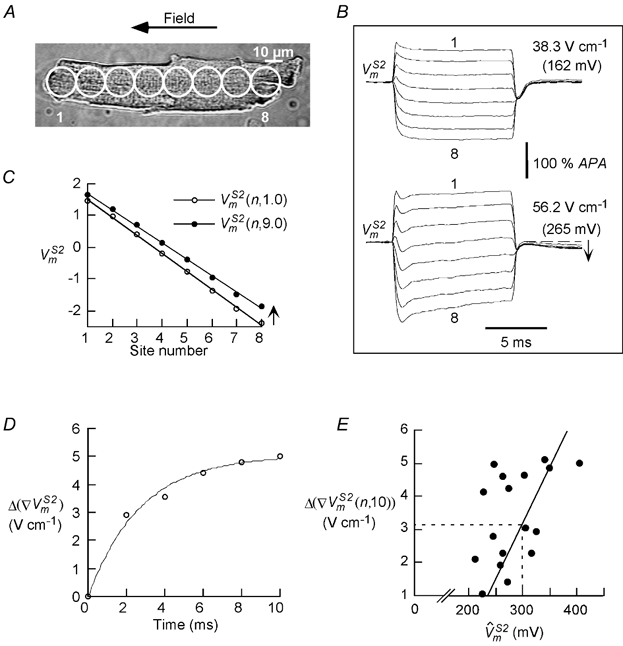
Figure 7.

s with non-parallel time courses at high field intensities
A, a cell (length:143 μm)that was successively stimulated with S2 stimuli of 38.3 and 56.2 V cm−1. B, upper and lower sets of traces, show the responses for the two S2 stimuli,which change from a parallel behaviour (at 38.3 V cm−1) to non-parallel behaviour (at 56.2 V cm−1). Moreover,following the pulse a depression in the plateau potential was observed for the S2 of 56.2 V cm−1, indicated by the arrow in B, lower set of traces. For comparison with other cells the s are indicated in parentheses. C, the S2 response measured at 1 ms ((n, 1.0)) and 9 ms ((n, 9.0)). The (n, 9.0) decreased in slope, and shifted in the depolarizing direction from (n, 1.0). D, the slope reduction Δ (∇), which is equivalent to the internal field Ei, rises exponentially during S2 (τ = 2.7 ms). E, the slope reduction at the end of S2, Δ(∇(n, 10)), increases monotonically with (r = 0.66, P < 0.05, n = 17).The dashed lines indicate that Ei is 3.2 V cm−1 for a of 300 mV.
