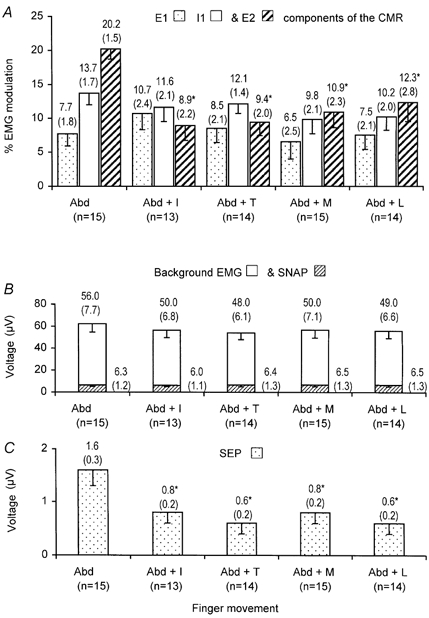
Figure 3.

Mean data (−1 s.e.m.) obtained from all subjects showing the effect of finger tapping upon the CMR, SEP, SNAP and EMG
Mean size of each component (top) and s.e.m. (bracketed) are given above each bar for each chart. A, CMR recorded from 1DI, following stimulation the of the index finger digital nerves during a sustained abduction of the index finger alone (Abd) contrasting the CMR obtained during index finger (Abd + I), thumb (Abd + T), middle finger (Abd + M) and little finger (Abd + L) tapping. Stippled bars: mean size of E1 component. Open bars: mean size of the I1 component. Hatched bars: mean size of the E2. component Significant differences were found in the size of the E2 component on comparing the differences between the means obtained during abduction and each finger movement (rmANOVA, P < 0.05, denoted *). Components E1 and I1 were not significantly altered (rmANOVA, P > 0.05 in both cases). B, SNAP recorded from the median nerve at the wrist and background EMG recorded from IDI during index finger abduction following electrical stimulation of the index finger digital nerves for each finger tapping task performed as described in A. Hatched bars: mean size of the SNAP recorded from the median nerve. Open bars: mean size of the background EMG. C, SEP recorded from the contralateral sensory cortex, following electrical stimulation of the index finger digital nerves whilst performing a sustained voluntary abduction of the index finger compared to the effect of abducting the index finger with concomitant tapping of the finger as described in A. Stippled bars: mean size of the N20/P25 component of the SEP. Significant differences in the size of the N20/P25 components were found on comparing the means obtained during abduction and each finger movement (rmANOVA, P < 0.05, denoted *).
