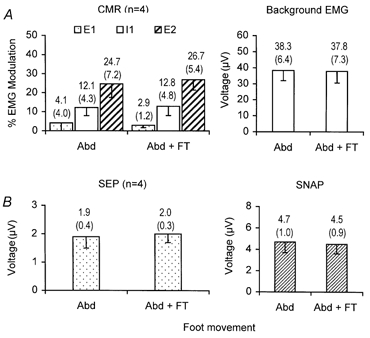
Figure 4.

Mean data (-1 s.e.m.) obtained from four subjects showing the effect of ipsilateral foot tapping on the components of the CMR, background EMG, SEP and SNAP
Mean data value (top) and s.e.m. (bracketed) are shown on the chart above each bar. A, CMR and background EMG recorded from 1DI, whilst stimulating the digital nerves of the index finger during sustained abduction of the index finger alone (Abd) contrasting the CMR obtained during foot tapping (Abd + FT). Stippled bars: mean size of the component E1 of the reflex. Open bars: mean size of the I1 component of the reflex. Hatched bars: mean size of the component E2 of the reflex. Open bars (right bar chart): mean size of the background EMG. B, SEP recorded from the contralateral sensory cortex and SNAP recorded from the median nerve at the wrist. Stippled bars: mean size of the N20/P25 component of the SEP. Hatched bars: mean size of the afferent volley.
