
Figure 1. Pattern of changes over 6 days of the Mn2+ quenching rate in isolated normal and mdx fibres.
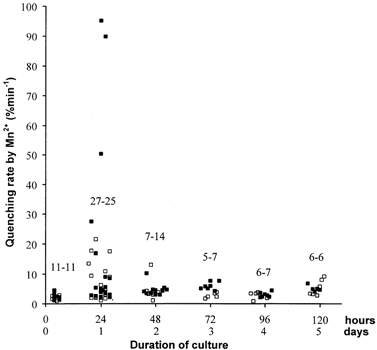
One hundred and thirty-two individual measurements of the fluorescence-quenching rate by Mn2+ in Fura-PE3 loaded fibres. Temporal progression from 2 h after enzymatic isolation (d0) to 120 h after (d5). The time scale is also given in hours because the position of each point corresponds to the exact time after isolation when the measurement was made. Above each group of points, the first figure is the number of normal fibres (C57, open squares), the second is the number of mdx fibres (filled squares). Fibres were obtained from 18 normal and 20 mdx mice.