
Figure 5. Developmental changes in the amplitude of glycine-evoked whole-cell currents and in their sensitivity to picrotoxin.
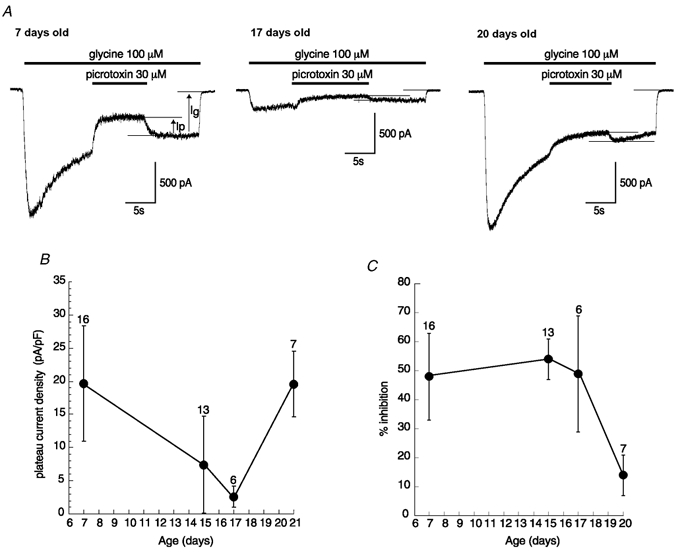
A, examples of whole-cell currents evoked by 100 μm glycine and their inhibition by the transient application of 30 μm picrotoxin at three developmental stages (VH / −70 mV). Traces were digitized at 10 kHz and filtered at 1 kHz. B, changes in the current density amplitude measured at the plateau current evoked by 100 μm glycine (Ig) at different developmental stages (mean amplitudes ± s.d., number of neurones tested given above). The current density amplitudes measured at P15 and P17 were significantly lower than those measured at P7 and P20 (ANOVA-DMCT, P < 0.001). C, changes in the percentage inhibition of the current evoked by 100 μm glycine in response to 30 μm picrotoxin applications at different ages. The percentage inhibition is calculated as the ratio of the current decrease in the presence of picrotoxin (Ip) to Ig. Mean ± s.d. The percentage inhibition at P20 was significantly lower than at P7, P15 and P17 (ANOVA-DMCT, P < 0.001).