
Figure 4. [Pi] dependence of tension, stiffness and initial tension recovery.
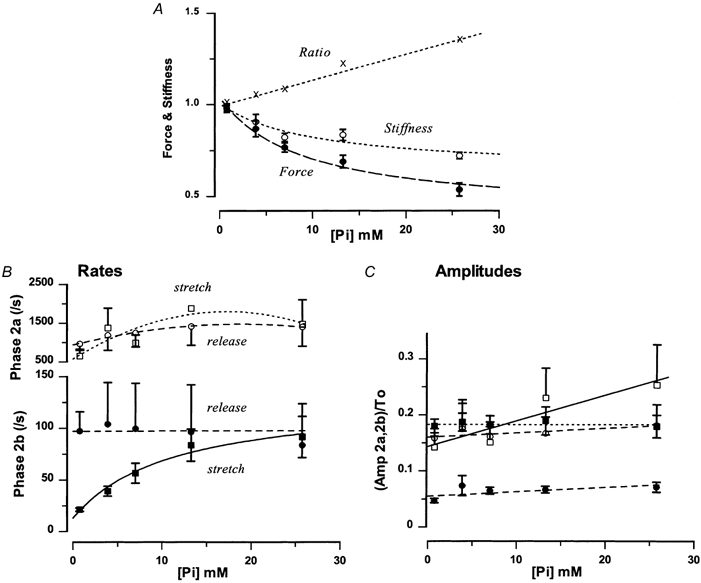
A, the mean (± s.e.m.) steady tension (•) and the mean (± s.e.m.) stiffness (○) recorded at different levels of [Pi] are shown. Data are from five fibres in each of which data were collected at each level of [Pi]. Stiffness was determined as the tension change (i.e. as ΔT = T1 - T0) to a standard stretch (0.4-0.5 % L0)) and both the steady tension and the stiffness are plotted as ratios of that in the control solution (no added Pi). The abscissa is the [Pi] within active fibres calculated as given in Methods (see Coupland et al. 2001). A hyperbolic curve was fitted to each set of data. Note that both stiffness and tension are depressed with added Pi, but the tension depression is greater than the stiffness change. Consequently, the average stiffness/tension ratio (ΔT/T0) increases with added [Pi], as shown by the (×) symbols and the dotted line. The average ratio for 25 mm [Pi] is 1.34, which compares with the ratio of the T1 slopes (1.33) given in Fig. 3. B, the initial recovery of tension (the decay in stretches and rise in releases, between T1 and T2) was analysed by fitting a bi-exponential curve (see Fig. 3A). The two rate constants (for phases 2a and 2b) for different [Pi] are shown as means (± s.e.m.) where, rate 2a (□, ○ - upper ordinate) and rate 2b (▪, • - lower ordinate) are plotted separately for stretches (□, ▪) and releases (○, •). For clarity, plus or minus error bars are not shown for some data points. The slower phase 2b rate (▪, continuous curve) from stretches (only) is correlated with [Pi] and the hyperbolic curve gives a maximum rate of 129 s−1, minimum of 13 s−1 and half-maximum [Pi] of 11 mm (continuous curve through the points, r = 0.77). Others show no correlation with [Pi] (dotted and dashed curves). (The hyperbolic relation was also found for reciprocal half-time data from stretches; it corresponded to a maximum rate of 760 s−1, a minimum rate of 99 s−1 and a half-maximal [Pi] of 11 mm. The data from releases showed no correlation with [Pi] (P > 0.05)). C, the amplitudes of the two exponential components for stretches (□, ▪) and releases (○, •) are plotted separately against [Pi]; each amplitude is plotted as a ratio of steady force (T0). Both amplitudes of release and of phase 2b from stretches show no correlation (dotted and dashed lines, P > 0.05), but the amplitude of phase 2a from stretches is positively correlated (□, continuous line, P < 0.05).