
Figure 9. Arachidonic acid sensitivity of ATP current through VDACL channels.
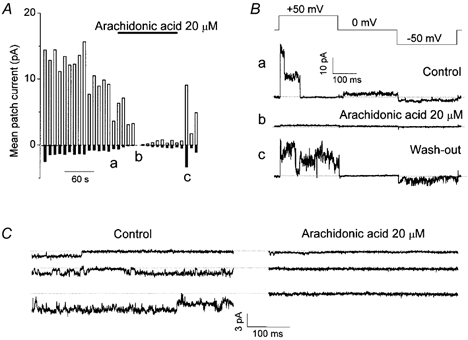
A, mean patch currents in an inside-out patch measured at ±50 mV. All anions in the bath were replaced with 100 mm ATP. Upper horizontal bar represents the time of arachidonic acid (20 μm) application. Data represent 12 similar experiments. a, b and c indicate the times when the traces in B were recorded. B, current traces recorded during application of alternating pulses from 0 to ±50 mV (protocol is shown at the top of the traces) before application of arachidonic acid (a), in the presence of 20 μm arachidonic acid (b), and after washout (c). C, representative inward ATP4- currents recorded at −50 mV from three different patches before (left: control) and during (right) application of 20 μm arachidonic acid.