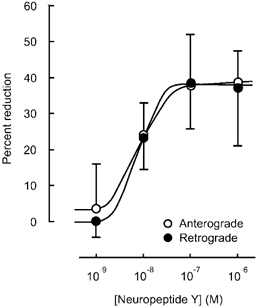
Figure 4. Concentration dependence of NPY-induced reduction in the number of particles transported in anterograde and retrograde directions.

Percentage reduction in the number of transported particles at various concentrations of NPY. The value obtained 15 min after each application of NPY was compared to the value before the application (control), and is expressed as a percentage. Each point indicates the mean (± s.d.) of the values obtained from five DRG cells.
