
Figure 5. Histogram of instantaneous velocity of individual particles moving in anterograde (A) and retrograde (B) directions.
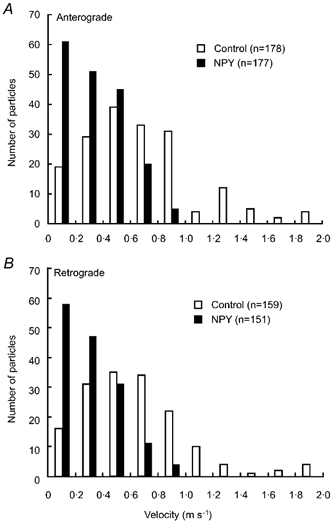
Data were obtained before (control) and during application of 1 μM NPY.
Official websites use .gov
A
.gov website belongs to an official
government organization in the United States.
Secure .gov websites use HTTPS
A lock (
) or https:// means you've safely
connected to the .gov website. Share sensitive
information only on official, secure websites.
Data were obtained before (control) and during application of 1 μM NPY.