
Figure 6. Effects of NPY Y1 and Y2 receptor agonists on axonal transport.
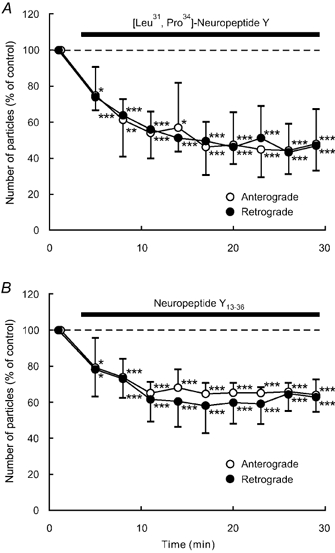
Percentage changes in the number of transported particles of control (the value before the application) in anterograde (open circles) and retrograde (closed circles) directions induced by the Y1 receptor agonist [Leu31,Pro34]-NPY (1 μM) (A) and Y2 receptor agonist NP13-36 (1 μM; B). Each data point represents the mean (± s.d.) of the values obtained from five DRG cells. * P < 0.05, ** P < 0.005, *** P < 0.0005 compared to the value before the application.