
Figure 9. Effects of SQ-22536 (A) or NPY after SQ-22536 treatment (B).
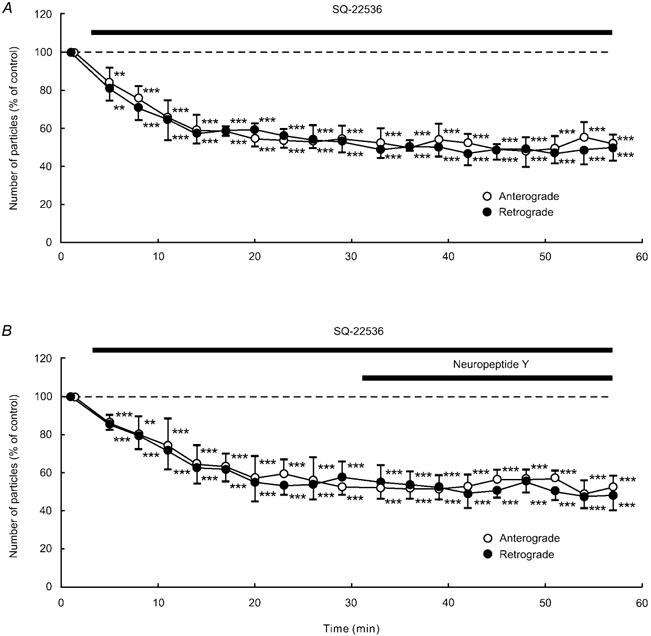
Data represent percentage changes in the number of transported particles. Cells were treated with the adenylate cyclase inhibitor SQ-22536 (100 μM) alone (A) or NPY (1 μM) after SQ-22536 (100 μM) treatment (B). Note that SQ-22536 inhibited anterograde and retrograde axonal transport, but the subsequently applied NPY failed to produce a further decrease in axonal transport. Each data point indicates the mean (± s.d.) of the values obtained from five DRG cells. * P < 0.05, ** P < 0.005, *** P < 0.0005 compared to the value before the application of SQ-22536.