
Figure 12. Effects of forskolin (A) and a combination of forskolin and NPY (B).
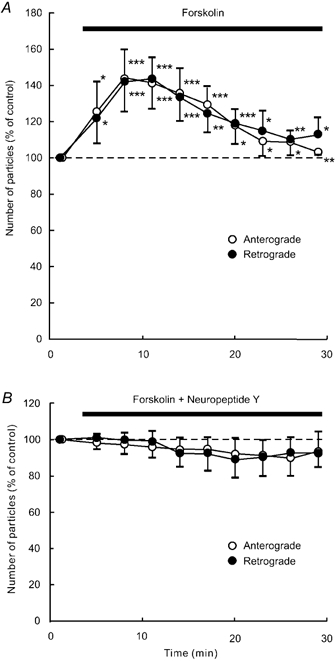
Data represent percentage changes in the number of transported particles. Cells were treated with the adenylate cyclase activator forskolin (1 μM) alone (A), or a combination of forskolin (1 μM) and NPY (1 μM; B). Note that NPY counteracted the effect of forskolin. Each data point indicates the mean (± s.d.) of the values obtained from five DRG cells. * P < 0.05, ** P < 0.005, *** P < 0.0005 compared to the value before the application.