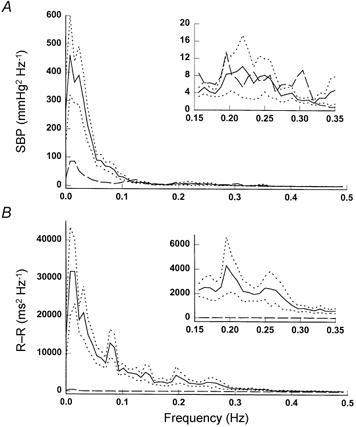
Figure 4.

Group averaged spectra of SBP (A) and R-R interval (B) variability before (continuous lines) and after (dashed lines) ganglion blockade. Dotted lines, s.e.m. Note that the plots in the insets have ‘zoomed’ scales at the frequencies from 0.15 to 0.35 Hz for the SBP spectrum in A and for the R-R spectrum in B.
