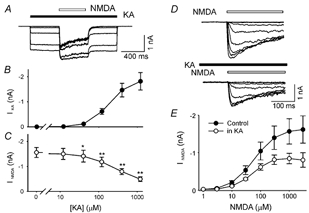
Figure 2. Kainate dose-dependently reduces NMDA-induced current in hippocampal neurones.

A, superimposed current records from a single isolated CA1 hippocampal neurone (VH = −60 mV) in response to a series of kainate pulses of different concentrations (KA, filled bar, 0, 12, 40, 120, 400 and 1200 μM). A 400 ms pulse of 100 μM NMDA (open bar) was delivered during the middle of each 1200 ms kainate pulse. B, dose-response curve for kainate-induced current (IKA). C, NMDAR current (INMDA) induced by 100 μM NMDA was significantly reduced by co-application of kainate at concentrations of 40 μM or higher (*P < 0.05; **P < 0.01, n = 7). INMDA is the difference between the peak of the current during NMDA application and the current before application of NMDA. D, all current recordings are from the same isolated hippocampal neurone in response to eight different concentrations of NMDA during control conditions (top traces) and in the presence of 200 μM kainate (bottom traces). E, dose-response relationships of NMDA-induced current are illustrated during control conditions (•) and in the presence of kainate (200 μM, ○). A logistic equation was used to estimate the maximum response (INMDA,max) and EC50 for each individual cell. In the presence of kainate INMDA,max was reduced from 1.66 ± 0.37 nA to 0.89 ± 0.15 nA (n = 5, P = 0.038). However, there was no difference in the estimated EC50 during control (61 ± 5 μM) and in the presence of kainate (47 ± 7 μM, n = 5, P = 0.18).
