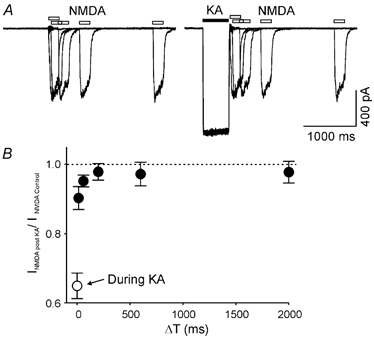
Figure 5. The recovery time course of NMDA current after activation of AMPARs.

A, two sets of superimposed current recordings obtained from the same isolated neurones in response to a brief pulse of NMDA (100 μM, open bars) in control conditions (left panel) and at variable times after a prepulse of kainate (200 μM, filled bar, right panel). B, summarized data show the time course of the recovery process of NMDA-induced current shortly after kainate-induced current (•, n = 10). ○, inhibition of NMDA-induced current during the kainate-induced current.
