
Figure 1. Transmission electron micrographs of rat PCD cells cultured in hypotonic, isotonic and hypertonic media.
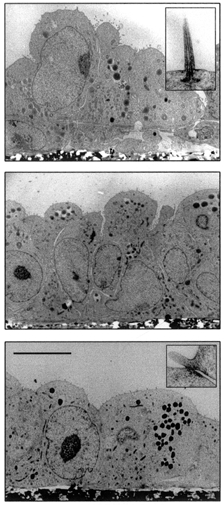
Upper panel, hypotonic medium (200 mosmol kg−1; inset, cilium); middle panel, isotonic medium (300 mosmol kg−1); lower panel, hypertonic medium (450 mosmol kg−1; inset, tight junction). Scale bar in lower panel applies to all panels and represents 10 μm.