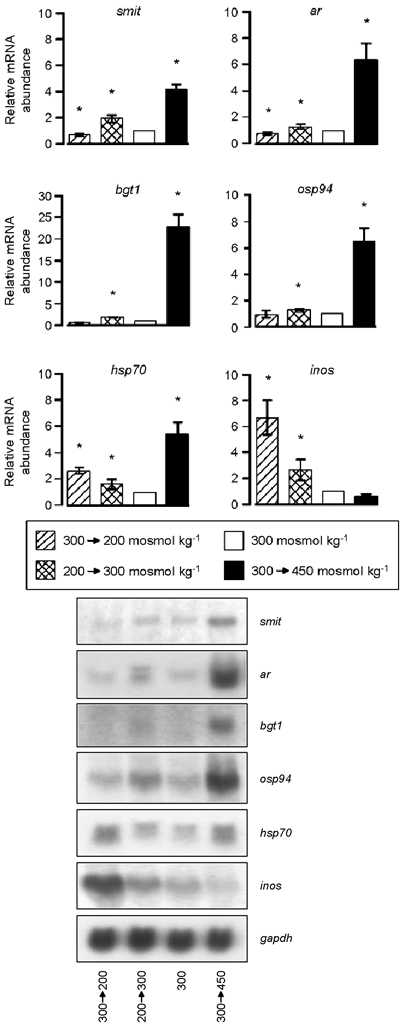
Figure 4. Effect of hypotonicity and hypertonicity on expression of tonicity-responsive genes.

Primary cultures of rat PCD cells were grown at 300 mosmol kg−1. Thereafter, cultures were either continued in this medium (control) or transferred for 12 h to hypertonic (450 mosmol kg−1) or hypotonic (200 mosmol kg−1) medium. Some of the latter cultures were subsequently returned to isotonic (300 mosmol kg−1) medium for 12 h. The mRNA abundance of the indicated genes was determined subsequently by Northern blot analysis and normalised to gapdh. Data are given as the relative mRNA abundance compared with isotonic controls (300 mosmol kg−1 = 1). Means ± s.e.m. for n = 5; * significantly different from value obtained in PCD cells kept at 300 mosmol kg−1. Representative blots are shown on the right.
