
Figure 3.
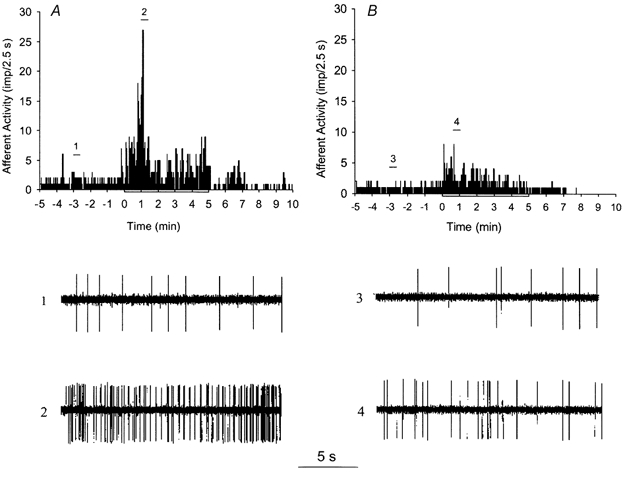
A and B, histograms showing the frequency of action potentials in a representative left ventricular afferent during control, ischaemia, and reperfusion, before and after the administration of antibody, respectively. Neurograms 1 and 2, taken at times indicated by bars in A, display the activity of the afferent before administration of antibody during control and ischaemia, respectively. Neurograms 3 and 4 display the activity of the afferent after antibody during control and ischaemia, respectively, at times shown in B.