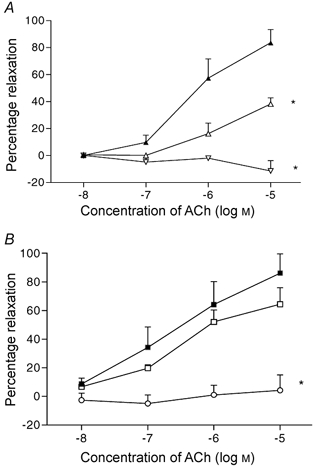
Figure 4. Responses to acetylcholine after l-NAME, apamin and charybdotoxin.

A, concentration-response relaxation curves in rats fed a low salt diet (n = 4) before blockers (▴), after l-NAME (dose 10−4m, ▵), and followed by apamin (Ap, 1 μM) and charybdotoxin (ChTx, 1 μM) (▿). B, same procedure in rats fed a high salt diet (n = 5), before blockers (▪), after l-NAME (▪), and followed by Ap and ChTx (○). * P < 0.01 vs. response curve prior to blockers.
