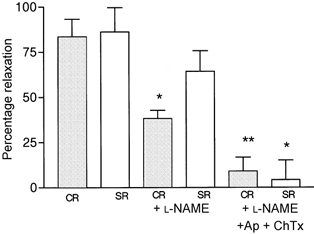
Figure 5. Comparison of maximum relaxation responses to ACh in the presence of inhibitors.

Bar diagram showing comparison of responses at the maximum dose of ACh used (10−5m), in low salt (CR) and high salt rats (SR), before inhibitors (left panels), after l-NAME (10−4m) (middle panels) and after apamin (Ap 1 μM) and charybdotoxin (ChTx 1 μM) in addition to l-NAME. * P < 0.01, ** P < 0.001 between corresponding values prior to addition of blockers.
