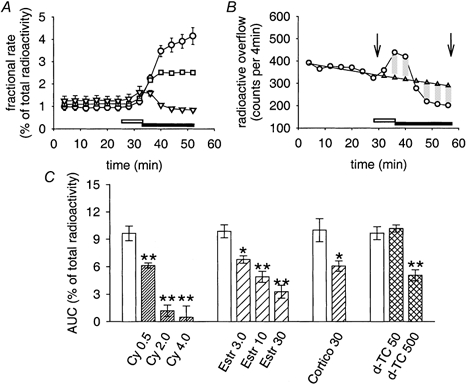
Figure 4. Effects of inhibitors of OCT3 on reserpine-induced [3H]-MPP+ outflow.

For all data shown, a radioactive outflow was induced by transient (8 min) applications of 0.3 μM reserpine (open horizontal bars in A and B), followed by 0.5 μM desipramine in the absence or presence of cyanine 863 (filled horizontal bars in A and B). A, [3H]-MPP+ outflow in response to 0.3 μM reserpine, modified by subsequent applications of: 0.5 μM desipramine (○); 0.5 μM desipramine plus 0.5 μM cyanine 863 (▪); or 0.5 μM desipramine plus 4 μM cyanine 863 (▿). Data points are mean fractional rates ± s.e.m. (n = 3). B, same experimental approach as shown in A (reserpine-induced [3H]-MPP+ release followed by co-applications of 4 μM cyanine 863 and 0.5 μM desipramine), but with data from a single culture plotted together with extrapolated basal release (▵). The AUC between arrows (-0.13 %) was calculated as shown in Fig. 2B. Note underestimation of effect of inhibitor due to its application only after reserpine. C, summary of effects of OCT3 inhibitors on reserpine-induced [3H]-MPP+ release with the experimental protocol shown in A and B. Open bars are matched controls of [3H]-MPP+ release in response to reserpine, followed by applications of 0.5 μM desipramine. Pattern-filled bars show results of inhibitors, co-applied with desipramine after the reserpine stimulus (cyanine 863 0.5, 2.0 and 4 μM, n = 8, 19 and 8, respectively, with matched controls, n = 20; oestradiol 3, 10 and 30 μM, n = 6, 13 and 9, respectively, with matched controls, n = 21; corticosterone 30 μM, n = 8, with matched controls, n = 9; d-TC 50 and 500 μM, n = 8 and 9, respectively, with matched controls, n = 18). Data are AUC values (means ± s.e.m.), calculated as shown in B and in Fig. 2B. Significantly different from control: * P < 0.05, ** P < 0.01 (Mann-Whitney U test).
