
Figure 5. Effects of LICI on IHI in a single subject.
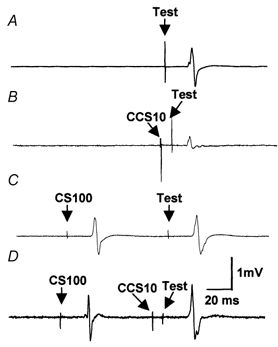
Traces represent the averaged waveform for a single subject. A, response to TS 1 mV alone (condition 3A). B, IHI alone: A contralateral conditioning stimulus (CCS10) inhibited the test response (condition 3B) compared to A. The TS was the same as in A. C. LICI alone: A conditioning stimulus (CS100) using a TS that evokes a 1 mV MEP if preceded by a CS100 stimulus (i.e. TS 1 mVCS100; condition 3F). The test MEP amplitude here is matched with that in A. D, combined LICI and IHI (condition 3G): In the presence of CS100, the CCS10 pulse caused no inhibition but a slight MEP facilitation compared to that shown in C.