
Figure 3. Paired pulse depression of eIPSCs at a single inhibitory terminal in elevated (5 mm) extracellular Ca2+.
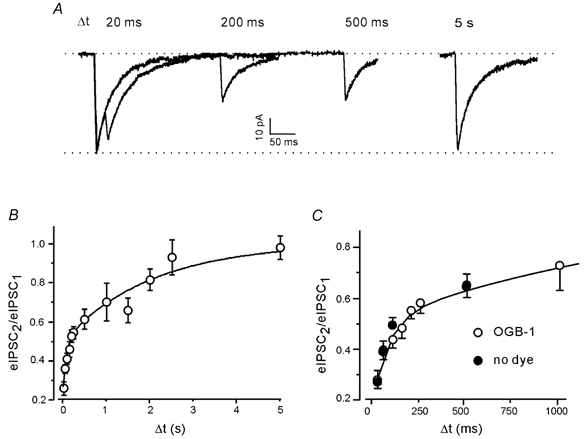
A, eIPSCs at several different inter-stimulus intervals (Δt). Each trace is the average of 25 responses. B, PPD as a function of inter-stimulus interval. Pooled data from 26 boutons after loading OGB-1. The continuous line represents a double exponential fit. C, PPD of eIPSCs was not changed by the presence of Ca2+-sensitive dye.