
Figure 2. The wavelength dependence of light scattered by corneal stroma as a function of NaCl concentration.
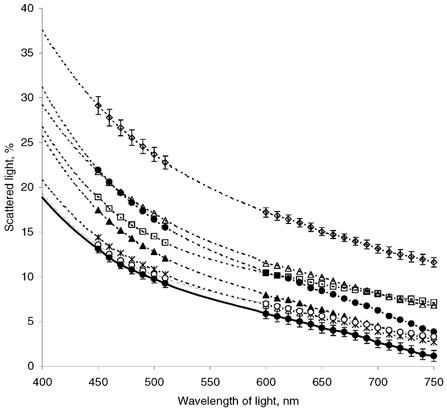
• and dotted line, 10 mm; ▴, 30 mm; ×|, 50 mm; ○, 100 mm; • and continuous line, 154 mm; ▪, 300 mm; ▵, 600 mm; ⋄, 1 m. Data from six corneas are averaged. Bars show s.e.m. for the lowest (154 mm) and the highest (1 m) NaCl concentrations.