
Figure 3. Three-dimensional representation of the transparency of the corneal stroma as a function of wavelength and concentration of NaCl.
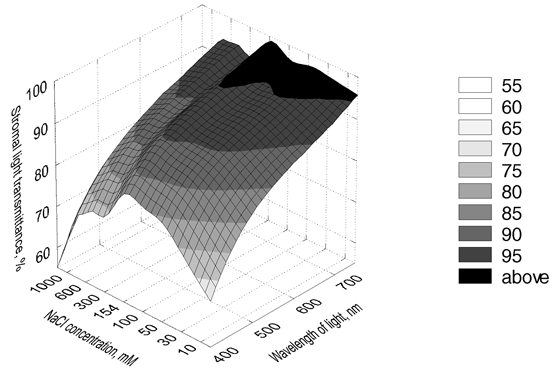
Data represent averaged values from six corneas for each concentration of NaCl.
Official websites use .gov
A
.gov website belongs to an official
government organization in the United States.
Secure .gov websites use HTTPS
A lock (
) or https:// means you've safely
connected to the .gov website. Share sensitive
information only on official, secure websites.
Data represent averaged values from six corneas for each concentration of NaCl.