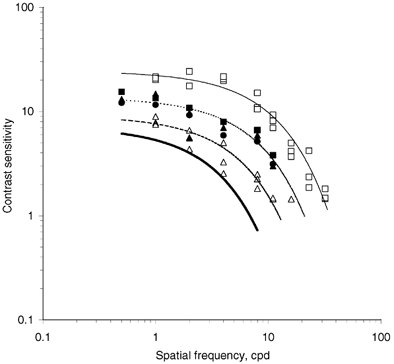
Figure 5. Modulation transfer functions.

Modulation transfer function of normal human (▪, continuous line), keratoconic human corneas (▵, dashed line) and bovine corneal stromas, equilibrated at 154 mm NaCl, with individual hydration close to 3.2 (▪, ▴, •, dotted line). Bovine corneal stromas equilibrated at 10 mm NaCl had contrast sensitivity below the estimated threshold shown as a continuous bold line. Data on keratoconic corneas were kindly supplied by T. M. Mubard & S. A. Hodson (personal communication) and shown here for a comparison. cpd, cycles per degree.
