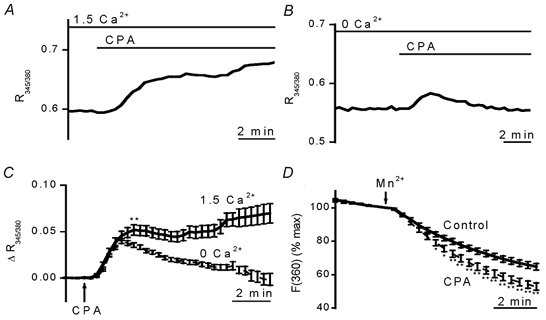
Figure 1. Responses of cerebral arteriolar smooth muscle cells to SR Ca2+ depletion.

D600 (10 μM) was present in all experiments. A-C, SERCA inhibition with 10 μM CPA caused elevation of [Ca2+]i that depended on extracellular Ca2+. [Ca2+]i is given as the ratio of 345 and 380 nm fura-PE3 signals (R345/380). Example experiments in standard (1.5 mm Ca2+) bath solution (A) and Ca2+-free bath solution containing 0.4 mm EGTA (B). C, summary of data from experiments as shown in A and B. Data are mean ± s.e.m. changes in fura-PE3 ratio. For each data point, n ≥ 32 (total N = 14) and 41 (total N = 15) for 1.5 mm Ca2+ and Ca2+-free groups, respectively. P < 0.001 for the data point marked ** and all subsequent data points. D, SR Ca2+ depletion slightly enhanced Mn2+ influx. Mn2+ quenching of fura-PE3 (excited at 360 nm) was increased by 10 μM CPA. Mn2+ was applied at 0.5 mm in Ca2+-free solution without EGTA. Points are mean ± s.e.m. data normalised to the fluorescence intensity before addition of Mn2+. Control group, n/N = 65/13. CPA group, n/N = 45/9. * P < 0.05, ** P < 0.01.
