
Figure 2. Adaptational changes of EMG activity during the three successive runs.
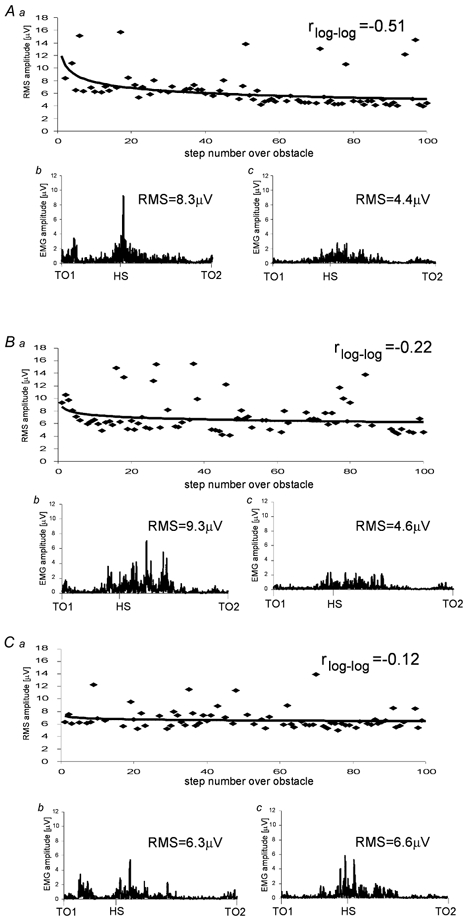
Rectus femoris (RF) EMG activity of one subject during steps over the obstacle during three successive runs: A, right leg leading; B, right leg leading; C, left leg leading. a, course of RF EMG calculated for 100 steps over the obstacle with fitted learning curve (power function). r represents Pearson's correlation coefficient for the normalised and logarithmically transformed data. b and c, rectified raw EMG of RF from toe off at the onset of swing (TO1) over the obstacle to the next toe off (TO2) during the first b and last c, steps over the obstacle. RMS values were calculated for this time interval.