
Figure 3. Knee and ankle joint trajectories during the three successive runs.
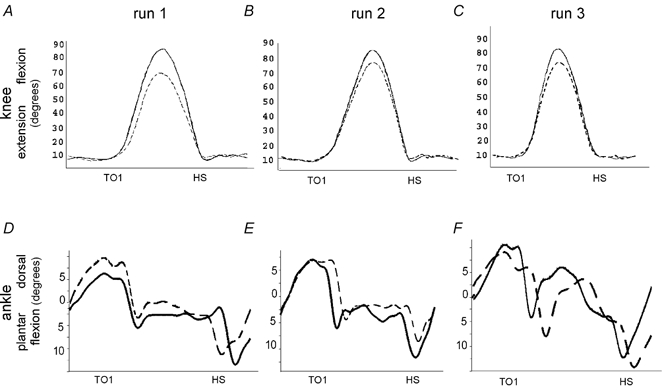
Representative individual example of changes in knee (above) and ankle (below) joint trajectories during run one (A and D, right leg was leading), two (B and E, right leg was leading) and three (C and F, left leg was leading). The solid line represents the first step over the obstacle within the run, the interrupted line the last step (step 100). TO1: toe off before onset of swing over obstacle; HS: heel strike.