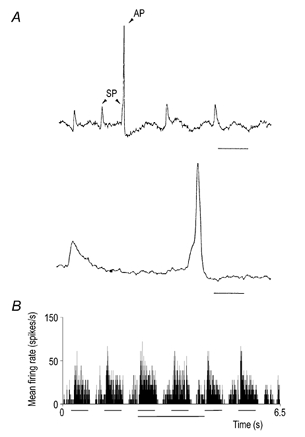
Figure 1. Recordings and PSTH illustrating visual response.

A, original recording trace showing differences between S-potentials (SP) and action potentials (AP). The lower trace shows the action potential and the preceding S-potential on a larger time scale. Notice the initial shoulder on the action potential indicating that the action potential takes off from an S-potential. Scale bar in upper trace, 25 ms, in lower trace 5 ms. B, a PSTH showing the response to the sequence of the 14 stimulus conditions for one spot size. This histogram was compiled from 20 repetitions; bin width 5 ms. The six horizontal lines under the histogram mark the periods (500 ms) when the visual stimulus was on (light spot for on-centre cells, dark spot for off-centre cells). The lowermost horizontal line marks the period during which the train-stimulation of PBR was applied.
