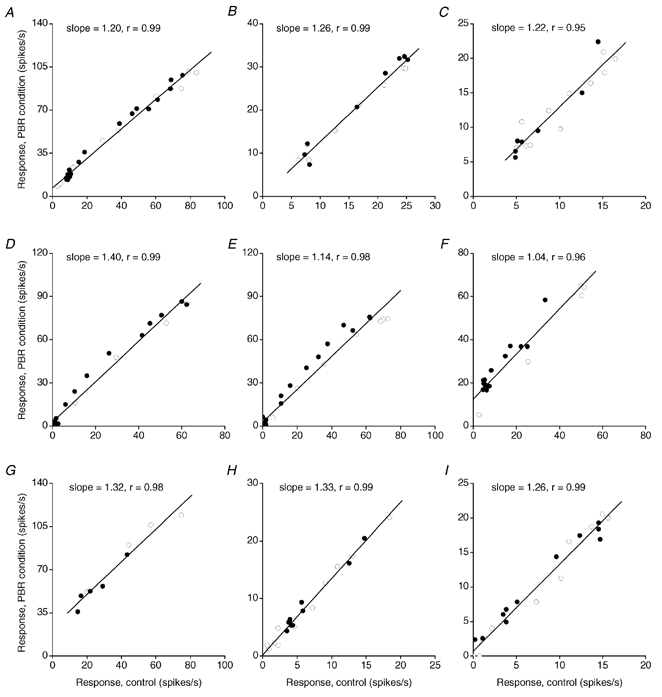
Figure 6. Linear relationship between response during PBR stimulation and response in the control condition.

Plots for 6 X cells (A-F) and 3 Y cells (G-I). ○s, response to stimuli smaller than or equal to the receptive field centre for the dLGN cell. •s, response to stimuli larger than the receptive field centre. Straight lines are linear regression lines fitted by method of least squares. Coefficient of correlation (r), and the slope of the regression line are indicated in each plot.
