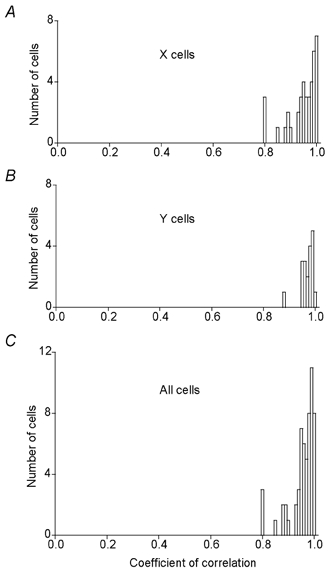
Figure 7. Response to the various spot sizes during PBR stimulation showed high correlation with the response in the control condition.

Frequency distribution of the coefficient of correlation for A, X cells; B, Y cells and C, all cells. Bin width 0.01.
