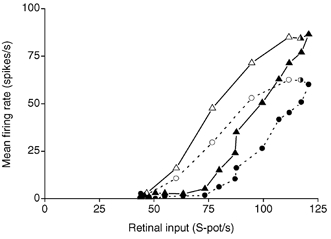
Figure 9. Effect of PBR stimulation on the output versus input relationship at the retinogeniculate relay.

Replot of data in Fig. 8A. Circles and dashed line, response in the control condition of the dLGN cell to each spot diameter plotted against the retinal input for the same spot diameter. Triangles and continuous line, the response of the dLGN cell during PBR stimulation. Open symbols, response to stimuli smaller than or equal to the receptive field centre for the dLGN cell. Filled symbols, response to stimuli larger than the receptive field centre.
