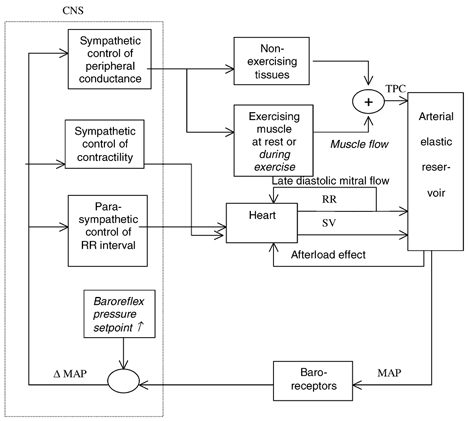
Figure 1. Block diagram representing the mathematical model of baroreflex control of human arterial circulation.

Arrows show information flow between blocks. CNS, central nervous system; TPC, total peripheral conductance; RR, RR interval; SV, stroke volume; MAP, mean arterial pressure. Equations (1) to (8) describe functional relationships between input and output of blocks. The text in italic font indicates the changes in the model from rest to exercise.
