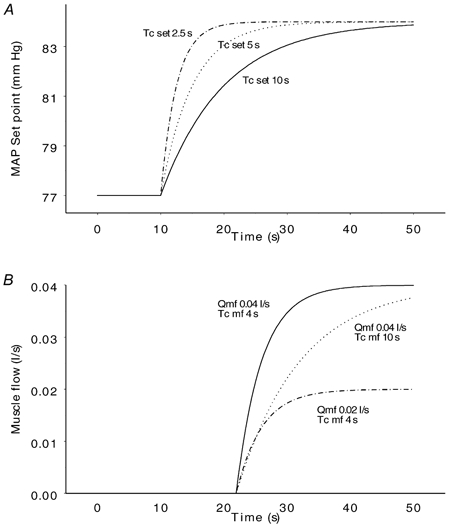
Figure 2. Baroreflex set point (A) and muscle flow (B).

The upper panel shows the development of the baroreflex set point with three different time constants. The set point increases from 77 to 84 mmHg with baroreflex time constants (Tc,set) of 2.5 s (upper curve), 5 s (middle curve) and 10 s (lower curve). The changes in set point start at time 10 s when the countdown starts as an expression of a central command. The lower panel shows the development of muscle flow with combinations of two different maximal muscle flows ( ) and two different muscle flow time constants (Tc,mf). In the upper and middle curves, muscle flow increases from 0 (the resting value) to a maximal value of 0.04 l s−1 with time constants of 4 s and 10 s respectively. In the upper and lower curves, the time constant is the same (4 s), but the maximal muscle flow is 0.04 l s−1 and 0.02 l s−1 respectively. The increase in muscle flow starts at time 20 s at the onset of exercise after a delay of 1.8 s (dmf).
